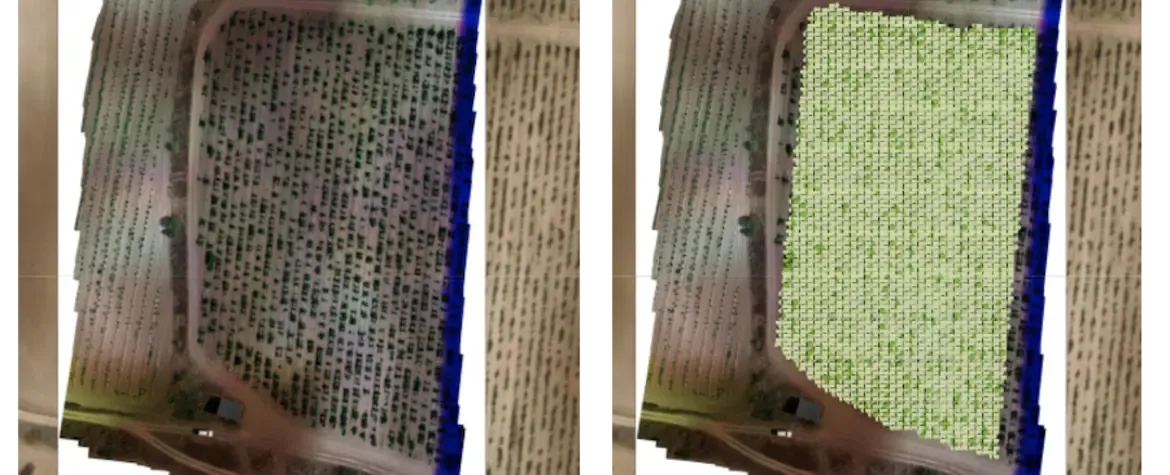
CanopyCover
A drone-imagery pipeline for precision viticulture that converts multispectral and thermal captures into calibrated maps, canopy metrics, water-stress indicators, and GIS-ready layers.
Technologies
Technical summary
Architecture overview
CanopyCover is a Python pipeline for precision viticulture research. It takes raw drone captures through calibration, registration, orthomosaic generation, vegetation analytics, and geospatial export, keeping each intermediate product tied to the same field coordinate frame.
I implemented the pipeline with Philipp Ackermann and Helmut Grabner as part of ZHAW’s Intelligent Viticulture project.
The system uses photogrammetry where the imagery has enough structure to support it, then switches to custom registration where sensor constraints make standard stitching brittle. RGB and multispectral products establish the spatial reference; thermal frames are projected into that reference instead of stitched independently.
Multispectral calibration and photogrammetry
The multispectral stage aligns the separate spectral bands with feature matching and homography estimation before computing vegetation indices. Small band offsets show up as noisy canopy boundaries, so registration happens before any NDVI-derived masking or aggregation.
After registration, the pipeline applies vignetting correction and radiometric calibration, then drives Agisoft Metashape to build RGB and multispectral orthomosaics. Those mosaics become the analysis surface for field-scale measurements rather than a loose set of independent captures.
Thermal-to-RGB co-registration
Thermal stitching was the main failure mode. The frames had low resolution, weak texture, and contrast patterns that did not produce stable geometry on their own.
The workaround was to use the RGB orthomosaic as the geometric anchor. For each thermal frame, the pipeline matches SIFT features against the RGB reference, filters inconsistent correspondences with RANSAC, and estimates an affine or homography transform. The warped thermal frames inherit the RGB map geometry while preserving temperature values for stress analysis.
Vegetation analytics and spatial decision layers
The analysis stage turns calibrated rasters into field-level measurements. NDVI masks isolate canopy from soil, and spatial aggregation converts those masks into canopy-cover metrics for defined field regions.
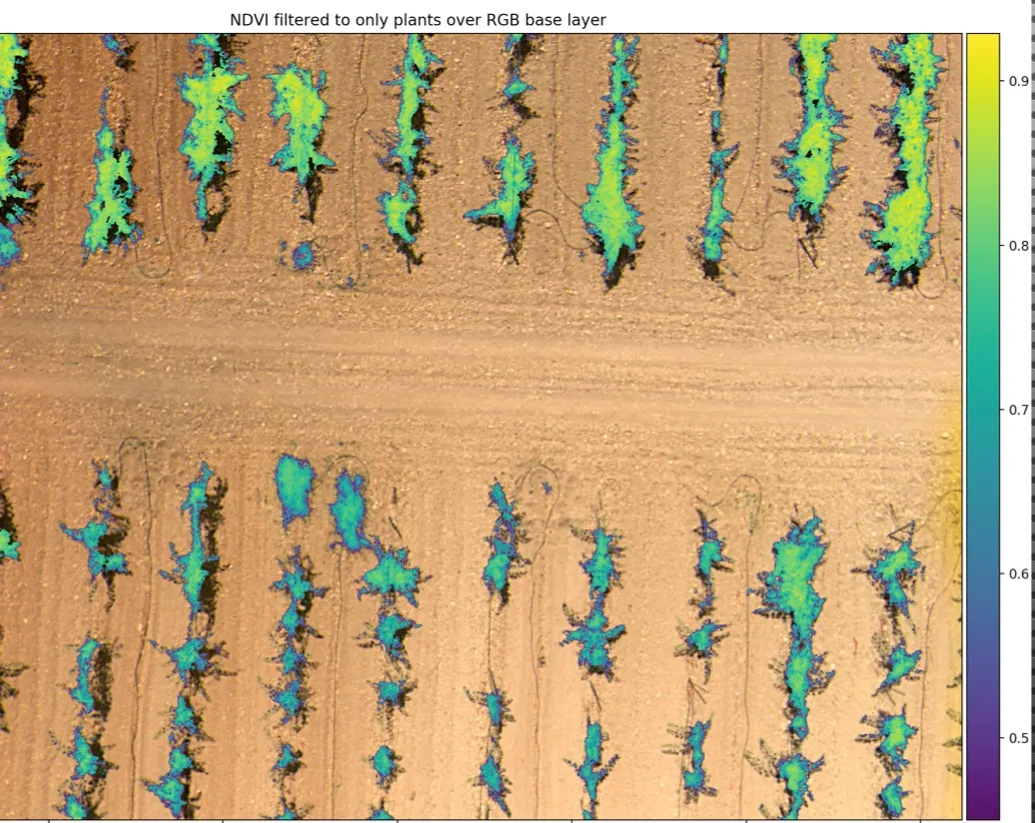
Aligned thermal data is normalized into CWSI-style indicators so the output highlights relative water stress across the field rather than raw temperature alone. The pipeline exports the resulting canopy and stress layers as GeoJSON and KMZ, making them usable directly in GIS tools and field-review workflows.
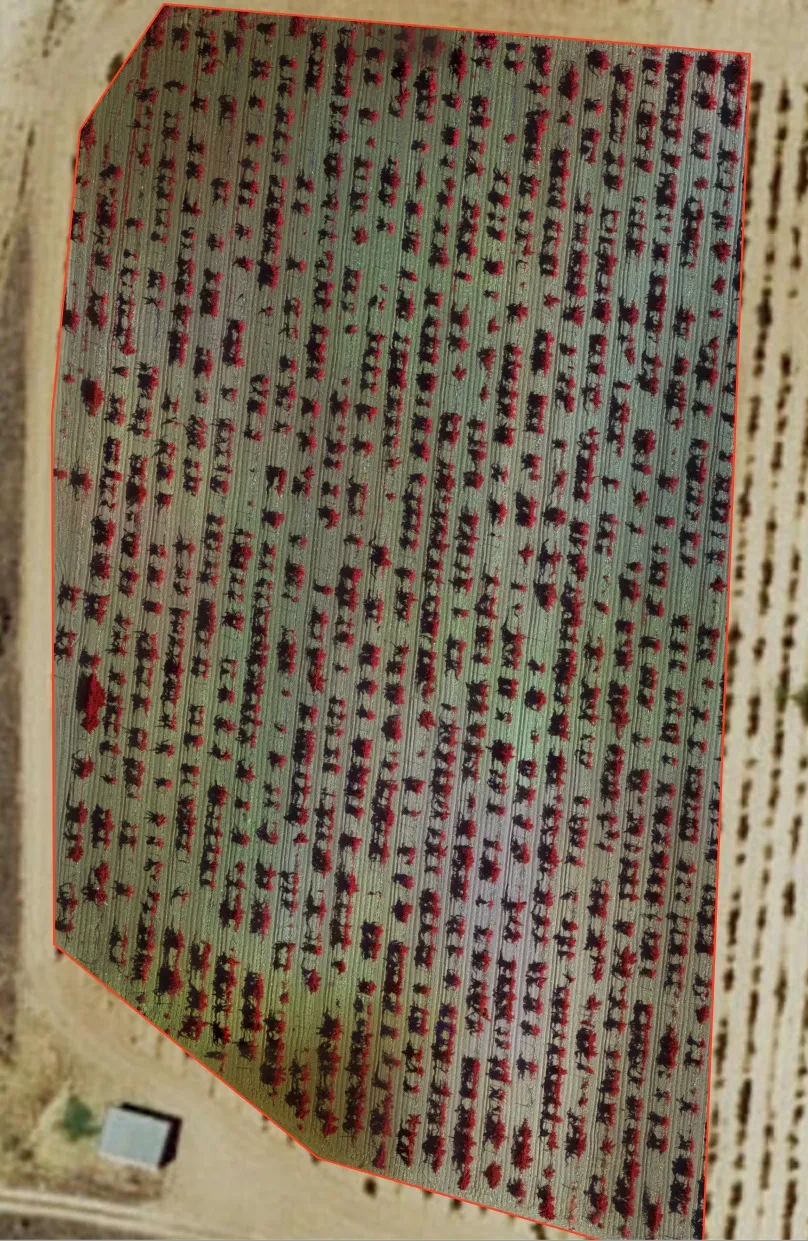
The same research program also included a grapevine disease-classification pipeline for screening field images across nine visual health classes.